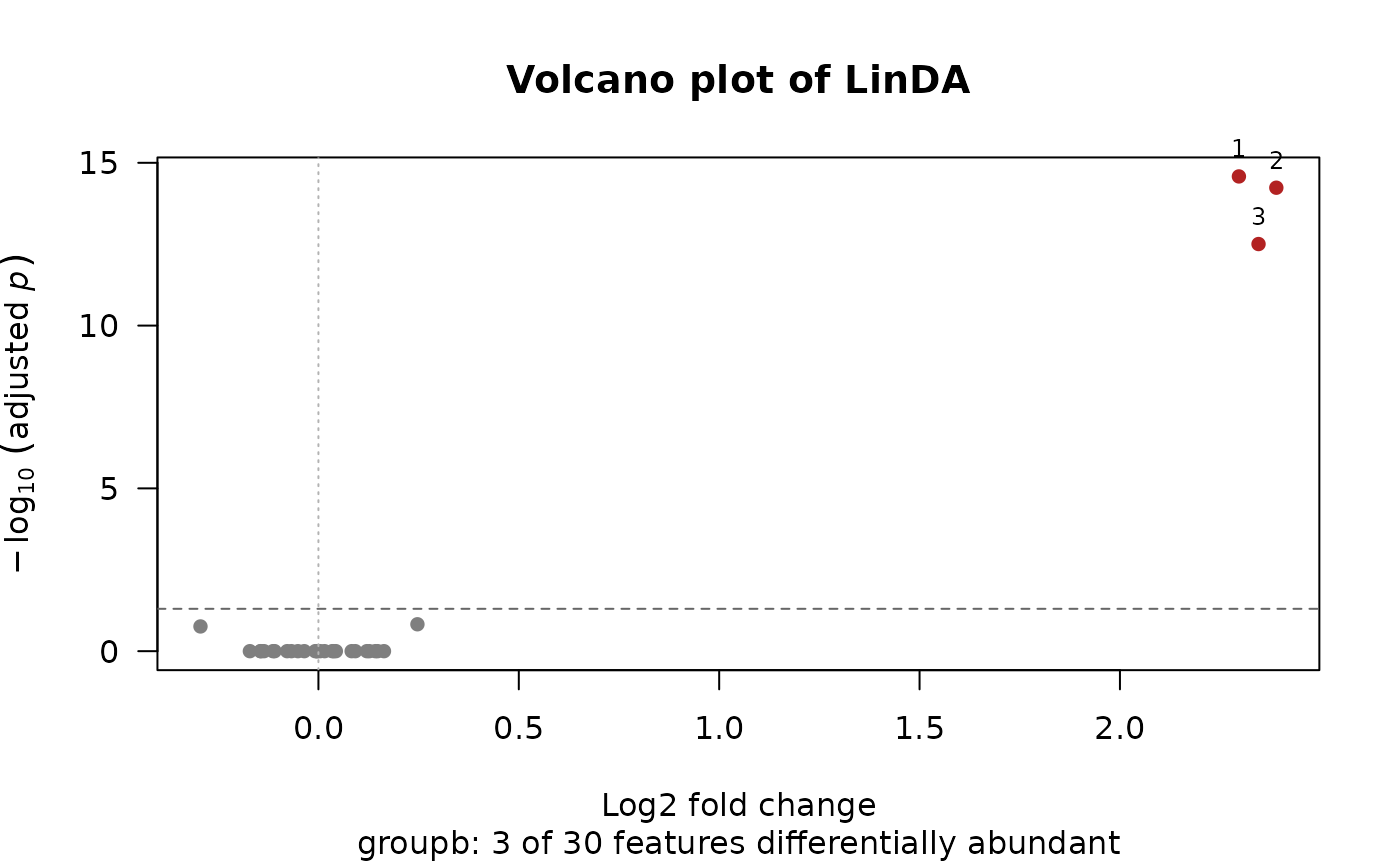
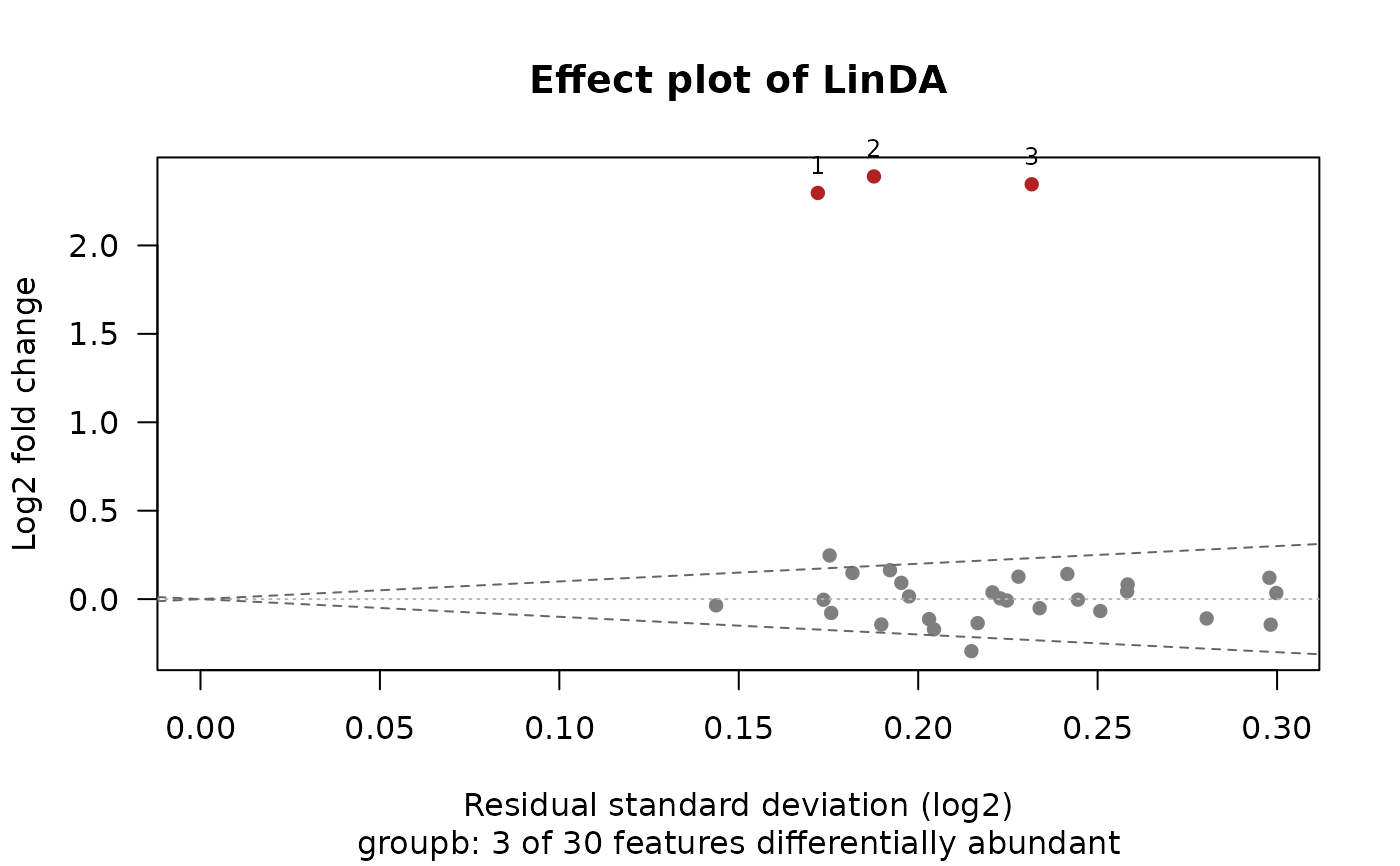
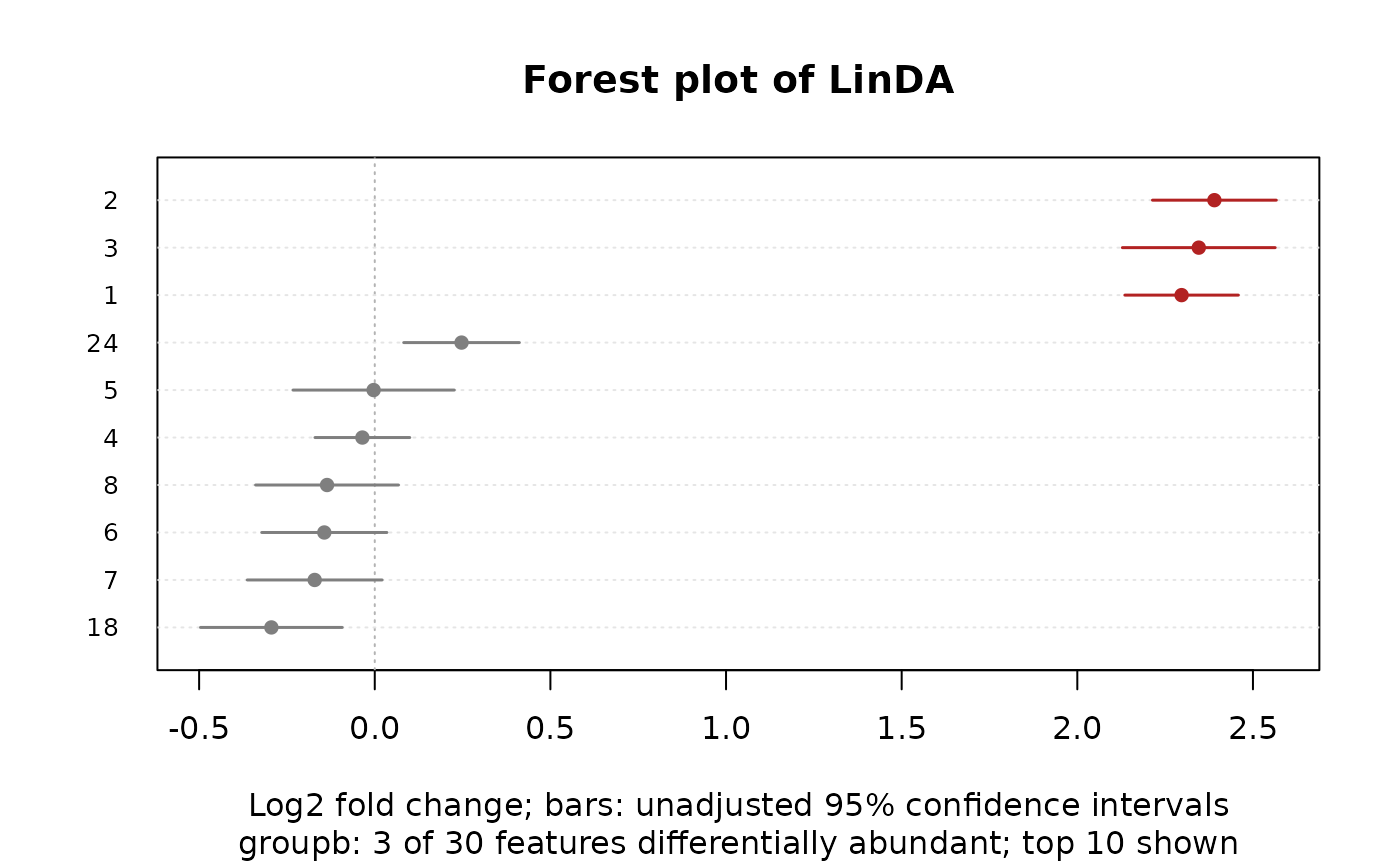
Views of a linda() result for one covariate, each feature a point (or
a row), with the features declared differentially abundant (reject = TRUE) highlighted and the most significant of them named:
Arguments
- x
The result of
linda().- covariate
Which covariate's log2 fold changes to plot, as named in the result's
covariatecolumn (such as"statusmoderate"or"age"). Defaults to the first column of the term of interest (groups), or else to the first covariate.- type
The plot:
"volcano"(the default),"effect","ma", or"forest".- labels
How many of the differentially abundant features to name (in the volcano, effect and MA plots), those with the smallest adjusted p-values. Default
10;0for none.- n_features
For
"forest": how many features to show, those with the smallest adjusted p-values (ties in the table's order). Default30;Inffor all.- conf_level
For
"forest": the confidence level of the intervals. Default0.95.- ...
Passed on to
graphics::plot.default(), such asmain,sub,xlab,xlimorcex.
Details
"volcano"(the default): the log2 fold change against the adjusted p-value."effect": the log2 fold change against the residual standard deviation (for a two-level comparison)."ma": the log2 fold change against the mean clr abundance."forest": the log2 fold changes and their confidence intervals of then_featuresmost significant features.
Log fold changes are in log2, as LinDA estimates them (the result's
log_base), bias-corrected.
Volcano plot. The y axis is \(-\log_{10}\) of
p_adjusted(an adjusted p-value of 0 is drawn at the smallest positive double), with a dashed line atalpha.Effect plot. The x axis is the feature's residual standard deviation (the
resid_sdattribute, log2); the dashed lines are \(y = \pm x\). Only for a covariate whose design column is 0 or 1 (a factor's level against its reference).MA plot. The x axis is the feature's mean centred log2 ratio (the
meanattribute).Forest plot. Bars over \(\mathrm{log2\_fc} \pm q\,\mathrm{se}\), with \(q\) the \((1 + \)
conf_level\()/2\) quantile of the t distribution withdofdegrees of freedom, as the p-values; they aren't adjusted for testing many features.
Features whose values are NaN are left out. The subtitle names the
covariate and counts the features rejected.