
Tests whether sample metadata, such as treatment groups, explain the
differences between samples in a distance matrix. Gives the same table as
vegan::adonis2(): degrees of freedom, sums of squares, \(R^2\), and
pseudo-\(F\) statistics, with permutation p-values. Computes them in
parallel C, straight from the distances, without the \(n \times n\)
matrices that adonis2() builds for every permutation.
Usage
permanova(
  dm,
  groups,
  data = NULL,
  formula = NULL,
  by = "overall",
  pairwise = FALSE,
  p_adjust = "holm",
  permutations = 999L,
  strata = NULL,
  seed = 0L,
  cpus = n_cpus()
)
Arguments
- dm
A
distobject, such as frombeta_div()orbray(), or a symmetric numeric matrix of distances. Must not containNAs or negative values. Alternatively, as invegan::adonis2(), a formula with the distances on its left-hand side and the terms to test on its right, such asdm ~ treatment, in place ofdmandformula; the metadata may then be given second, as inpermanova(dm ~ treatment, meta).- groups
The one variable to test: a vector or factor with one value per sample, matched to the samples in
dmby name when both are named, else in the same order asdm. Or, whendatais given, the name of one of its columns (or a vector with one value per row ofdata). Categories (factor, character, or logical) or a numeric covariate. The same asformula = ~ groups. Givegroupsorformula, not both.- data
Sample metadata: a data frame with one row per sample, holding the columns named in
groups,formula, orstrata. Rows are matched to the samples indmby row name, and rows for other samples are ignored; without row names, they must be in the same order asdm. Default:NULL.- formula
Instead of
groups, for models of several variables: a one-sided formula naming the variables indatato test, such as~ treatmentor~ treatment * site + ph. Factors, numeric covariates, and interactions are all allowed. Wrap variables inCondition()to remove their effect before the other terms are tested, as invegan::dbrda(). A left-hand side, if given, is ignored. Givegroupsorformula: there is no default model (as invegan::adonis2()). Default:NULL.- by
How to test the terms of
formula:'overall': One test of all the terms together. The default, as inadonis2()since vegan 2.6-8; earlier versions ofadonis2()defaulted toby = "terms", so compare with those usingby = 'terms'.'terms': Each term in turn, after the ones before it (sequential, or type I, sums of squares). Their order informulamatters.'margin': Each term after all the others (marginal sums of squares), for the terms that can be dropped without breaking marginality: in~ a * b, onlya:b.'onedf': Each column of the model matrix in turn, such as each contrast of a factor.
- pairwise
Also test each pair of groups: run the same test on just the two groups' samples, for every pair, and adjust the pairs' p-values for multiple testing with
p_adjust. See Pairwise comparisons. Default:FALSE.- p_adjust
With
pairwise = TRUE, how to adjust the pairs' p-values for multiple testing: one ofstats::p.adjust.methods('holm','hochberg','hommel','bonferroni','BH','BY','fdr', or'none'), matched asstats::p.adjust()matches them. Giving it withoutpairwise = TRUEis an error. Default:'holm'.- permutations
The number of permutations. Default:
999. Alternatively, a matrix with one permutation of1:nper row, as frompermute::shuffleSet(), to use instead of random ones.- strata
Permute samples only within these groups (blocks), for designs such as repeated measures. With
data, the name of one of its columns, or a vector with one value per row ofdata. Withoutdata, a vector with one value per sample, matched to the samples by name when it has names, otherwise in the same order. Default:NULL(free permutation).- seed
An integer seed for the random permutations. The same seed gives the same p-values. Default:
0- cpus
How many parallel processing threads should be used. The default,
n_cpus(), is the CPU cores this R process may use, within any limits set on it. Results are the same for anycpus.
Value
A list of class c("ecodive_permanova", "ecodive_test"), which
prints as a summary and the table of terms. as.data.frame() gives its
first four fields as one row, with the same columns as ecodive's other
permutation tests. The first four fields are for the model as a whole,
whatever by is (the "Model" row of by = 'overall'):
statistic: The model's pseudo-\(F\), namedF.p_value: Its permutation p-value.z: Its standardized effect size,(F - mean(f_perm)) / sd(f_perm), assummary(vegan::permustats()).n_perm: The number of permutations.r2: The model's \(R^2\): the proportion of the total sum of squares it explains.table: The table ofvegan::adonis2(): a data frame (of class"anova", so it prints likestats::anova()tables) with one row per term tested (or one"Model"row whenby = 'overall'), then"Residual"and"Total"rows. WhenformulahasCondition()terms, a"Conditional"row comes first. Its columns areDf(degrees of freedom),SumOfSqs(sum of squares),R2(proportion of the total sum of squares),F(pseudo-\(F\)), andPr(>F)(permutation p-value). Its attributef_permis a matrix of the \(F\) statistics of each permutation (rows) for each test (columns), asadonis2()'sF.perm.by: Thebyused.pairwise: Withpairwise = TRUE, a data frame with one row per pair of groups, named like"a-b", and columnsF,R2,z,n(the pair's samples),n_perm,p_value, andp_adjusted. Pairs are the groups of one categorical variable:groups, or the only term of aformulawith noCondition(). See Pairwise comparisons. OtherwiseNULL.p_adjust: Withpairwise = TRUE, thep_adjustmethod used. OtherwiseNULL.permutation: How samples were permuted:'free','within strata', or'supplied matrix'.
Attribute f_perm holds the model's \(F\) for each permutation.
Details
Method
PERMANOVA (Anderson 2001) partitions the variation in the distances among
the terms of a linear model, following McArdle & Anderson (2001): with
\(A\) the squared distances, \(G = -\frac{1}{2}JAJ\) Gower's centred
matrix, and \(H\) the hat matrix of the (centred) model, a model's sum
of squares is \(trace(HGH)\), out of a total \(trace(G) =
\frac{1}{n}\sum_{i<j}d_{ij}^2\). The pseudo-\(F\) of a term with
\(q\) degrees of freedom is
$$F = \frac{SS_{term} / q}{SS_{residual} / (n - 1 - p)}$$
where \(p\) counts the degrees of freedom of the whole model. For each
permutation, the samples' distances are shuffled relative to the metadata
and \(F\) is recomputed. The p-value is the proportion of permutations,
counting the observed one, with an \(F\) at least as large:
\((1 + \#\{F_{perm} \ge F\}) / (1 + permutations)\). As in adonis2(),
permuted statistics within sqrt(.Machine$double.eps) of the observed one
count as ties.
Partial models, with Condition() terms, follow vegan::dbrda() and
vegan::anova.cca()'s default "reduced" model: the conditions' effect is
removed from the distances, and the residuals are permuted.
Every term is tested with the same permutations of the (conditioned)
distances, as in adonis2(). PERMANOVA+ for PRIMER instead permutes the
residuals of a separate reduced model for each term (Freedman & Lane
1983), which can give slightly different p-values for terms after the
first.
Speed and memory
With \(Q\) an orthonormal basis of the model matrix, \(trace(HGH) =
\sum_c q_c^T G q_c\), and each \(q^T G q = -\sum_{i<j} q_i q_j
d_{ij}^2\) is read straight from dm. A permutation of the samples
permutes the rows of \(Q\), so each permutation costs one pass over the
distances, shared by many vectors at once, with no \(n \times n\)
matrix. For a single factor, the sum of squares within groups is summed
over the pairs of samples in the same group instead (Anderson 2001), which
is faster still. Permutations run in parallel.
Reproducibility
The permutations come from seed, not from R's random number generator,
so set.seed() has no effect, and each permutation has a random number
stream of its own. P-values are identical from run to run and for any
number of cpus. The random permutations differ from adonis2()'s, so
p-values agree with it only up to sampling error, unless the same
permutations matrix is given to both.
Differences from adonis2()
permanova()takes distances, not a community table: compute them first withbeta_div()or a metric function such asbray(). One variable can be given asgroups, like ecodive's other tests; several asformula, withdata.adonis2()'s style,permanova(dm ~ terms, data), also works.adonis2()'s table is thetablefield, and its permuted \(F\) statistics (F.perm) areattr(res$table, 'f_perm').A term with no degrees of freedom left (aliased with the terms before it) has no \(F\) or p-value (
NA), whereadonis2()reports an infinite or undefined \(F\).stratapermutes freely within strata. For other restricted designs, pass apermutationsmatrix frompermute::shuffleSet().When there are fewer possible permutations than requested,
adonis2()(viapermute) runs each of them once instead.permanova()always draws random permutations.
Pairwise comparisons
With pairwise = TRUE, each pair of groups is also tested on its own,
as q2-diversity's beta_group_significance(pairwise=True) does: the
distances are cut down to the two groups' samples, and the same test is
run on them, with the same number of permutations, the same strata
(cut down too), and the test's other arguments. The overall test is
unchanged.
Permutations: Each pair has random permutations of its own, drawn from
seedand the pair's position in the table, never from the number ofcpus. So a pair's p-value is reproducible, but differs (by sampling error) from that of the same test run by hand on the pair's samples with the sameseed. A suppliedpermutationsmatrix is cut down to each pair's samples by following each permutation's cycles: each of the pair's samples goes to the next of the pair's samples on its cycle. That gives a permutation of the pair's samples, uniformly distributed when the full one is, which keeps any restriction the matrix has, such as permuting only within strata.Multiple testing: The pairs' permutation p-values are adjusted together with
stats::p.adjust(method = p_adjust). The default, Holm's method, controls the family-wise error rate whatever the dependence between the pairs' tests.'BH'controls the false discovery rate instead, as q2-diversity's q-values do. The raw p-values are kept as well.Pairs that can't be tested: A pair the test can't be run on, such as two groups of one sample each, gets
NAs, with a warning, rather than an error. A test's other warnings for a pair, such as all of its distances being 0, are passed on, naming the pair.
The pairwise field of the result is a data frame with one row per pair
of groups, named like "a-b", in the order of the groups' factor levels
(sorted values, for other vectors). Its columns are the test's
statistics for the pair, z, n (the pair's number of samples),
n_perm, p_value (unadjusted) and p_adjusted. The p_adjust field
names the method, and print() shows both.
References
Anderson, M. J. (2001). A new method for non-parametric multivariate analysis of variance. Austral Ecology, 26(1), 32-46. doi:10.1111/j.1442-9993.2001.01070.pp.x
Freedman, D., & Lane, D. (1983). A nonstochastic interpretation of reported significance levels. Journal of Business & Economic Statistics, 1(4), 292-298. doi:10.1080/07350015.1983.10509354
McArdle, B. H., & Anderson, M. J. (2001). Fitting multivariate models to community data: a comment on distance-based redundancy analysis. Ecology, 82(1), 290-297. doi:10.1890/0012-9658(2001)082[0290:FMMTCD]2.0.CO;2
Examples
# 30 samples in three treatment groups. The 'high' group has more
# of the first five genera.
set.seed(1)
counts <- matrix(rpois(30 * 20, 5), 30, 20)
rownames(counts) <- paste0('S', 1:30)
meta <- data.frame(
row.names = rownames(counts),
treatment = rep(c('ctrl', 'low', 'high'), each = 10),
ph = round(rnorm(30, 7, 0.3), 1) )
high <- meta$treatment == 'high'
counts[high, 1:5] <- counts[high, 1:5] + 5
dm <- bray(counts)
# Does treatment explain differences in community composition?
res <- permanova(dm, 'treatment', meta)
res
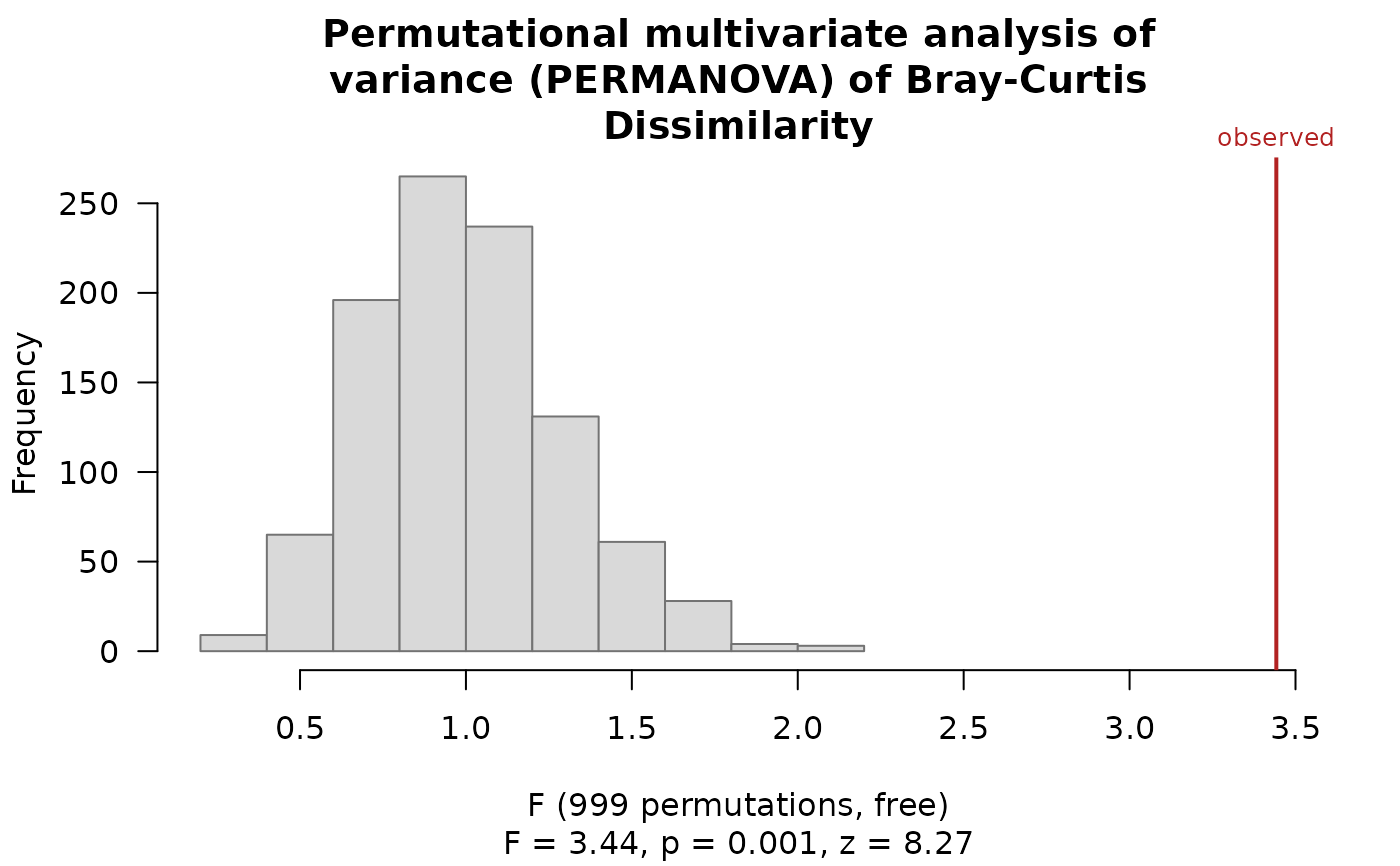
#> Permutational multivariate analysis of variance (PERMANOVA) of Bray-Curtis Dissimilarity
#>
#> F = 3.442, p = 0.001, z = 8.275
#> Permutations: 999 (free)
#>
#> Model R2 = 0.2032. Model tested as a whole:
#>
#> Df SumOfSqs R2 F Pr(>F)
#> Model 2 0.1813 0.2032 3.442 0.001 ***
#> Residual 27 0.7111 0.7968
#> Total 29 0.8924 1.0000
#> ---
#> Signif. codes: 0 ‘***’ 0.001 ‘**’ 0.01 ‘*’ 0.05 ‘.’ 0.1 ‘ ’ 1
# The pseudo-F of each permutation, and the observed one.
plot(res)
 # The same, with the groups as a vector.
permanova(dm, meta$treatment)
#> Permutational multivariate analysis of variance (PERMANOVA) of Bray-Curtis Dissimilarity
#>
#> F = 3.442, p = 0.001, z = 8.275
#> Permutations: 999 (free)
#>
#> Model R2 = 0.2032. Model tested as a whole:
#>
#> Df SumOfSqs R2 F Pr(>F)
#> Model 2 0.1813 0.2032 3.442 0.001 ***
#> Residual 27 0.7111 0.7968
#> Total 29 0.8924 1.0000
#> ---
#> Signif. codes: 0 ‘***’ 0.001 ‘**’ 0.01 ‘*’ 0.05 ‘.’ 0.1 ‘ ’ 1
# F, p-value and z-score as one row, and adonis2()'s table.
as.data.frame(res)
#> test stat_name statistic p_value z n_perm
#> 1 permanova F 3.442219 0.001 8.274905 999
res$table
#> Permutation test for PERMANOVA
#> Model tested as a whole
#> Permutation: free
#> Number of permutations: 999
#>
#> Df SumOfSqs R2 F Pr(>F)
#> Model 2 0.18132 0.20317 3.4422 0.001 ***
#> Residual 27 0.71110 0.79683
#> Total 29 0.89242 1.00000
#> ---
#> Signif. codes: 0 ‘***’ 0.001 ‘**’ 0.01 ‘*’ 0.05 ‘.’ 0.1 ‘ ’ 1
# Several variables: a formula. Each term in turn, after the ones
# before it.
permanova(dm, data = meta, formula = ~ treatment + ph, by = 'terms')
#> Permutational multivariate analysis of variance (PERMANOVA) of Bray-Curtis Dissimilarity
#>
#> F = 2.415, p = 0.001, z = 5.633
#> Permutations: 999 (free)
#>
#> Model R2 = 0.2179. Terms added sequentially (first to last):
#>
#> Df SumOfSqs R2 F Pr(>F)
#> treatment 2 0.1813 0.2032 3.377 0.001 ***
#> ph 1 0.0131 0.0147 0.490 0.925
#> Residual 26 0.6980 0.7821
#> Total 29 0.8924 1.0000
#> ---
#> Signif. codes: 0 ‘***’ 0.001 ‘**’ 0.01 ‘*’ 0.05 ‘.’ 0.1 ‘ ’ 1
# The same, in adonis2()'s style.
permanova(dm ~ treatment + ph, meta, by = 'terms')
#> Permutational multivariate analysis of variance (PERMANOVA) of Bray-Curtis Dissimilarity
#>
#> F = 2.415, p = 0.001, z = 5.633
#> Permutations: 999 (free)
#>
#> Model R2 = 0.2179. Terms added sequentially (first to last):
#>
#> Df SumOfSqs R2 F Pr(>F)
#> treatment 2 0.1813 0.2032 3.377 0.001 ***
#> ph 1 0.0131 0.0147 0.490 0.925
#> Residual 26 0.6980 0.7821
#> Total 29 0.8924 1.0000
#> ---
#> Signif. codes: 0 ‘***’ 0.001 ‘**’ 0.01 ‘*’ 0.05 ‘.’ 0.1 ‘ ’ 1
# pH, after removing the effect of treatment.
permanova(dm, data = meta, formula = ~ ph + Condition(treatment))
#> Permutational multivariate analysis of variance (PERMANOVA) of Bray-Curtis Dissimilarity
#>
#> F = 0.4895, p = 0.944, z = -1.371
#> Permutations: 999 (free)
#>
#> Model R2 = 0.01473. Model tested as a whole:
#>
#> Df SumOfSqs R2 F Pr(>F)
#> Conditional 2 0.1813 0.2032
#> Model 1 0.0131 0.0147 0.49 0.944
#> Residual 26 0.6980 0.7821
#> Total 29 0.8924 1.0000
# Which treatments differ? Each pair of groups, with Holm-adjusted
# p-values.
res <- permanova(dm, 'treatment', meta, pairwise = TRUE)
res$pairwise
#> F R2 z n n_perm p_value p_adjusted
#> ctrl-high 5.9754504 0.24923204 10.864373 20 999 0.001 0.003
#> ctrl-low 0.6324614 0.03394406 -1.091117 20 999 0.859 0.859
#> high-low 4.6962047 0.20691586 8.573431 20 999 0.001 0.003
# False discovery rate instead.
permanova(dm, 'treatment', meta, pairwise = TRUE, p_adjust = 'BH')$pairwise
#> F R2 z n n_perm p_value p_adjusted
#> ctrl-high 5.9754504 0.24923204 10.864373 20 999 0.001 0.0015
#> ctrl-low 0.6324614 0.03394406 -1.091117 20 999 0.859 0.8590
#> high-low 4.6962047 0.20691586 8.573431 20 999 0.001 0.0015