Cluster samples by beta diversity k-means.
Usage
bdiv_clusters(
  biom,
  bdiv = "bray",
  weighted = NULL,
  normalized = NULL,
  tree = NULL,
  k = 5,
  alpha = 0.5,
  cpus = n_cpus(),
  ...
)
Arguments
- biom
An rbiom object, or any value accepted by
as_rbiom().- bdiv
Beta diversity distance algorithm(s) to use. Options are:
c("aitchison", "bhattacharyya", "bray", "canberra", "chebyshev", "chord", "clark", "sorensen", "divergence", "euclidean", "generalized_unifrac", "gower", "hamming", "hellinger", "horn", "jaccard", "jensen", "jsd", "lorentzian", "manhattan", "matusita", "minkowski", "morisita", "motyka", "normalized_unifrac", "ochiai", "psym_chisq", "soergel", "squared_chisq", "squared_chord", "squared_euclidean", "topsoe", "unweighted_unifrac", "variance_adjusted_unifrac", "wave_hedges", "weighted_unifrac"). For the UniFrac family, a phylogenetic tree must be present inbiomor explicitly provided viatree=. Supports partial matching. Multiple values are allowed for functions which return a table or plot. Default:"bray"- weighted
(Deprecated - weighting is now inherent in bdiv metric name.) Take relative abundances into account. When
weighted=FALSE, only presence/absence is considered. Multiple values allowed. Default:NULL- normalized
(Deprecated - normalization is now inherent in bdiv metric name.) Only changes the "Weighted UniFrac" calculation. Divides result by the total branch weights. Default:
NULL- tree
A
phyloobject representing the phylogenetic relationships of the taxa inbiom. Only required when computing UniFrac distances. Default:biom$tree- k
Number of clusters. Default:
5L- alpha
The alpha term to use in Generalized UniFrac. How much weight to give to relative abundances; a value between 0 and 1, inclusive. Setting
alpha=1is equivalent to Normalized UniFrac. Default:0.5- cpus
The number of CPUs to use. Set to
NULLto use all available, or to1to disable parallel processing. Default:NULL- ...
Passed on to
stats::kmeans().
See also
Other beta_diversity:
bdiv_boxplot(),
bdiv_corrplot(),
bdiv_heatmap(),
bdiv_ord_plot(),
bdiv_ord_table(),
bdiv_stats(),
bdiv_table(),
distmat_stats()
Other clustering:
taxa_clusters()
Examples
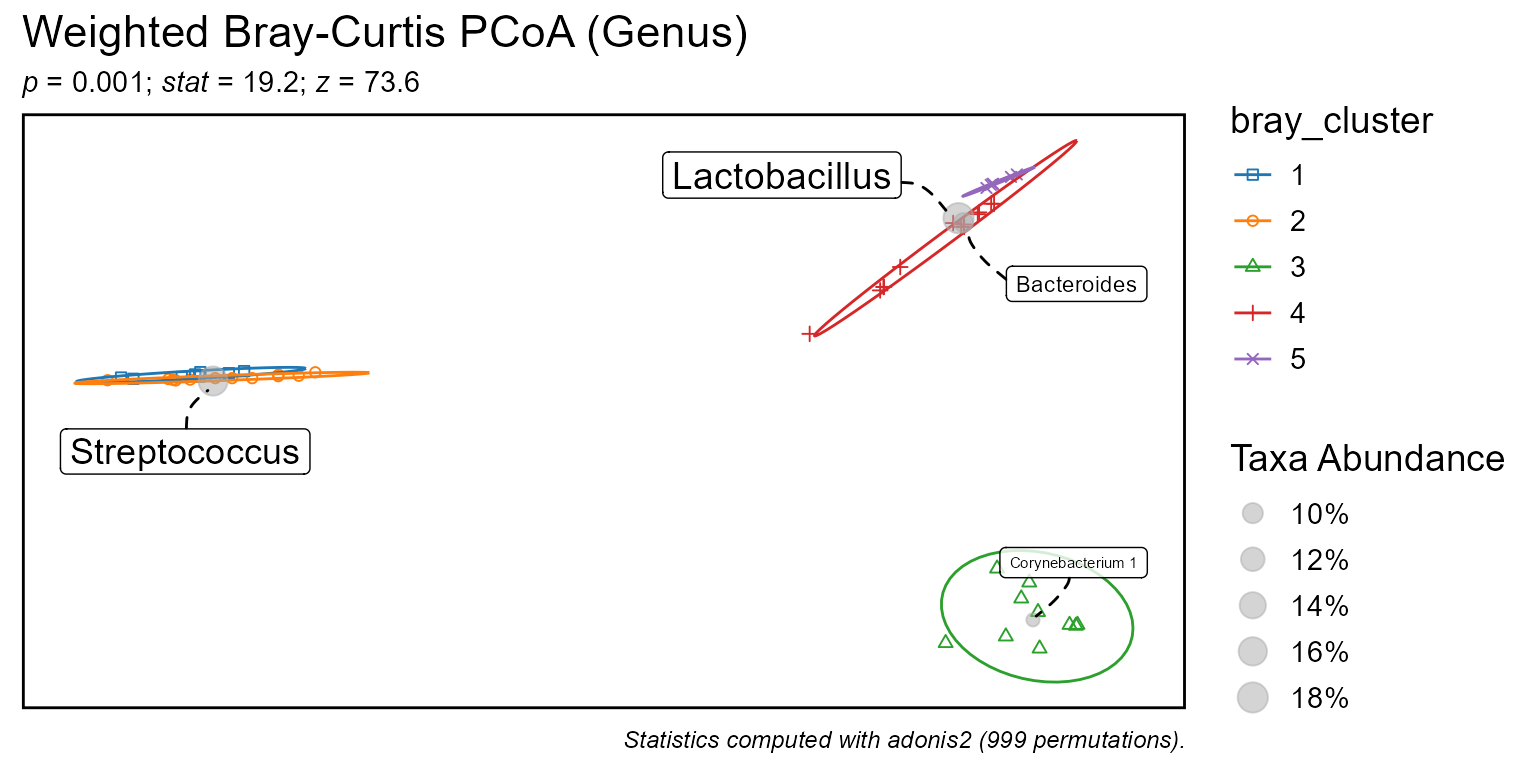
    library(rbiom)

    biom <- rarefy(hmp50)
    biom$metadata$bray_cluster <- bdiv_clusters(biom)

    pull(biom, 'bray_cluster')[1:10]
#> HMP01 HMP02 HMP03 HMP04 HMP05 HMP06 HMP07 HMP08 HMP09 HMP10
#>     1     5     5     5     1     5     1     5     5     4
#> Levels: 1 2 3 4 5

    bdiv_ord_plot(biom, stat.by = "bray_cluster")