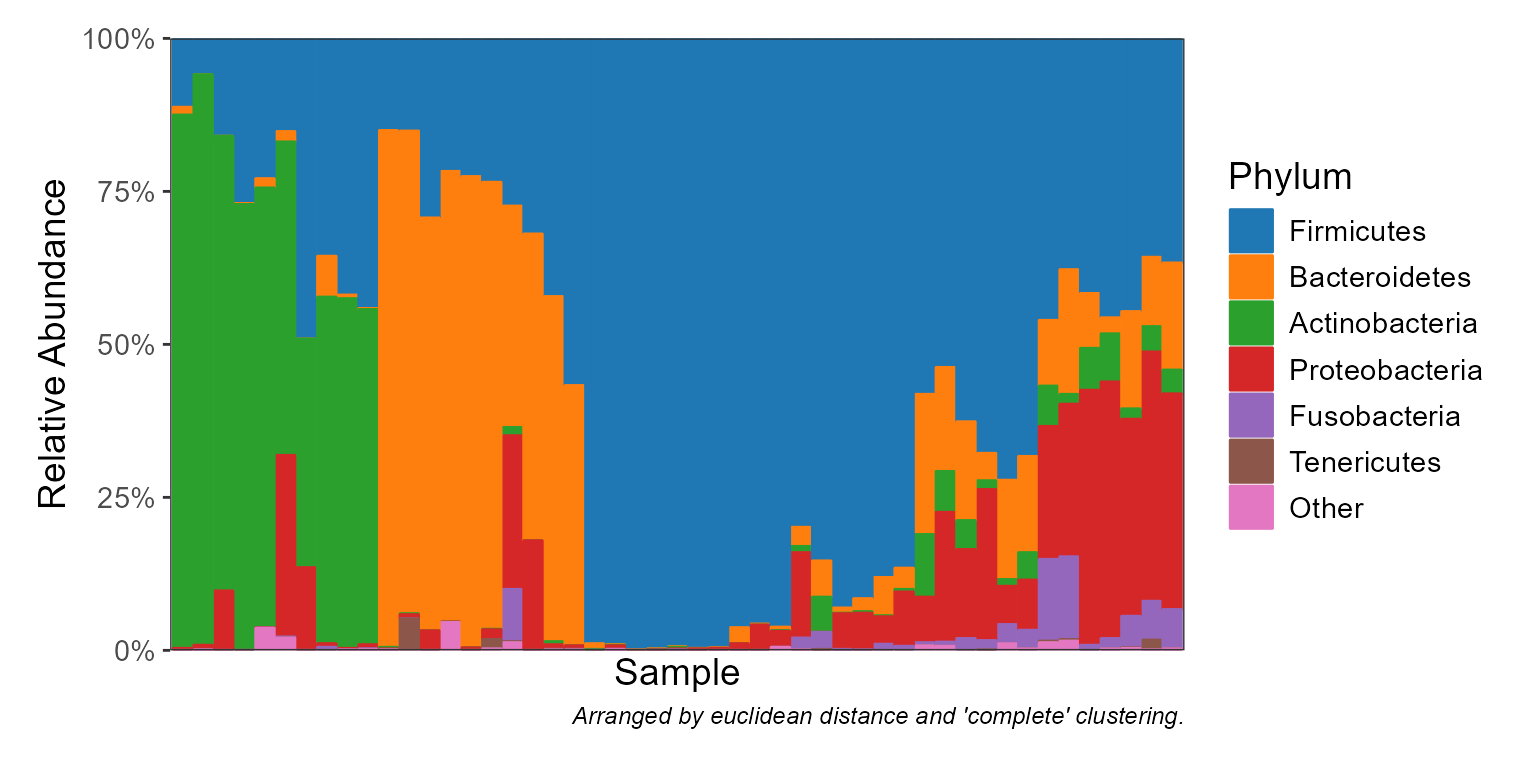
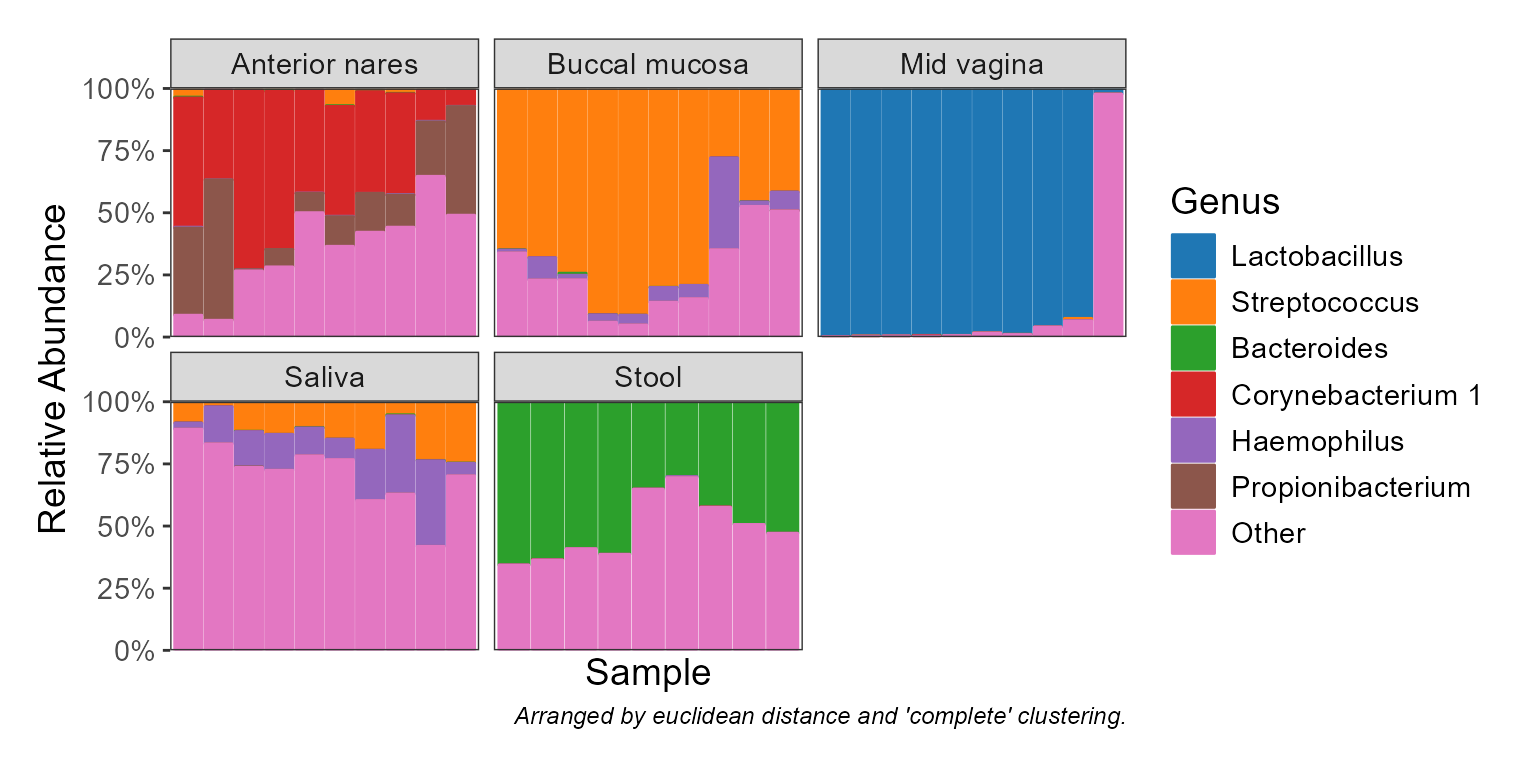
Display taxa abundances as a stacked bar graph.
Usage
taxa_stacked(
  biom,
  rank = -1,
  taxa = 6,
  colors = TRUE,
  patterns = FALSE,
  label.by = NULL,
  order.by = NULL,
  facet.by = NULL,
  dist = "euclidean",
  clust = "complete",
  other = TRUE,
  unc = "singly",
  lineage = FALSE,
  xlab.angle = 90,
  ...
)
Arguments
- biom
An rbiom object, or any value accepted by
as_rbiom().- rank
What rank(s) of taxa to display. E.g.
"Phylum","Genus",".otu", etc. An integer vector can also be given, where1is the highest rank,2is the second highest,-1is the lowest rank,-2is the second lowest, and0is the OTU "rank". Runbiom$ranksto see all options for a given rbiom object. Default:-1.- taxa
Which taxa to display. An integer value will show the top n most abundant taxa. A value 0 <= n < 1 will show any taxa with that mean abundance or greater (e.g.
0.1implies >= 10%). A character vector of taxa names will show only those named taxa. Default:6.- colors, patterns
A character vector of colors or patterns to use in the graph. A named character vector can be used to map taxon names to specific colors or patterns. Set to
TRUEto auto-select colors or patterns, or toFALSEto disable per-taxa colors or patterns. Default:colors=TRUE, patterns=FALSE.- label.by, order.by
What metadata column to use for labeling and/or sorting the samples across the x-axis. Set
label.by='.sample'to display sample names. Whenorder.by=NULL, samples are arranged based ondistandclust, below. Default:label.by=NULL, order.by=NULL.- facet.by
Dataset field(s) to use for faceting. Must be categorical. Default:
NULL- dist, clust
Distance (
stats::dist()) and clustering (stats::hclust()) methods to use for automatically arranging samples along the x-axis to put samples with similar composition near one another. Default:dist="euclidean", clust="complete".- other
Sum all non-itemized taxa into an "Other" taxa. When
FALSE, only returns taxa matched by thetaxaargument. SpecifyingTRUEadds "Other" to the returned set. A string can also be given to implyTRUE, but with that value as the name to use instead of "Other". Default:FALSE- unc
How to handle unclassified, uncultured, and similarly ambiguous taxa names. Options are:
"singly"-Replaces them with the OTU name.
"grouped"-Replaces them with a higher rank's name.
"drop"-Excludes them from the result.
"asis"-To not check/modify any taxa names.
Abbreviations are allowed. Default:
"singly"- lineage
Include all ranks in the name of the taxa. For instance, setting to
TRUEwill produceBacteria; Actinobacteria; Coriobacteriia; Coriobacteriales. Otherwise the taxa name will simply beCoriobacteriales. You want to set this to TRUE whenunc = "asis"and you have taxa names (such as Incertae_Sedis) that map to multiple higher level ranks. Default:FALSE- xlab.angle
Angle of the labels at the bottom of the plot. Options are
"auto",'0','30', and'90'. Default:"auto".- ...
Parameters for underlying functions. Prefixing parameter names with a layer name ensures that a particular parameter is passed to, and only to, that layer.
Value
A ggplot2 plot. The computed data points and ggplot
command are available as $data and $code,
respectively.
Details
If biom is rarefied, then relative abundance will be shown on the y-axis.
Otherwise, raw abundance will be displayed.
See also
Other taxa_abundance:
sample_sums(),
taxa_boxplot(),
taxa_clusters(),
taxa_corrplot(),
taxa_heatmap(),
taxa_stats(),
taxa_sums(),
taxa_table()
Other visualization:
adiv_boxplot(),
adiv_corrplot(),
bdiv_boxplot(),
bdiv_corrplot(),
bdiv_heatmap(),
bdiv_ord_plot(),
plot_heatmap(),
rare_corrplot(),
rare_multiplot(),
rare_stacked(),
stats_boxplot(),
stats_corrplot(),
taxa_boxplot(),
taxa_corrplot(),
taxa_heatmap()