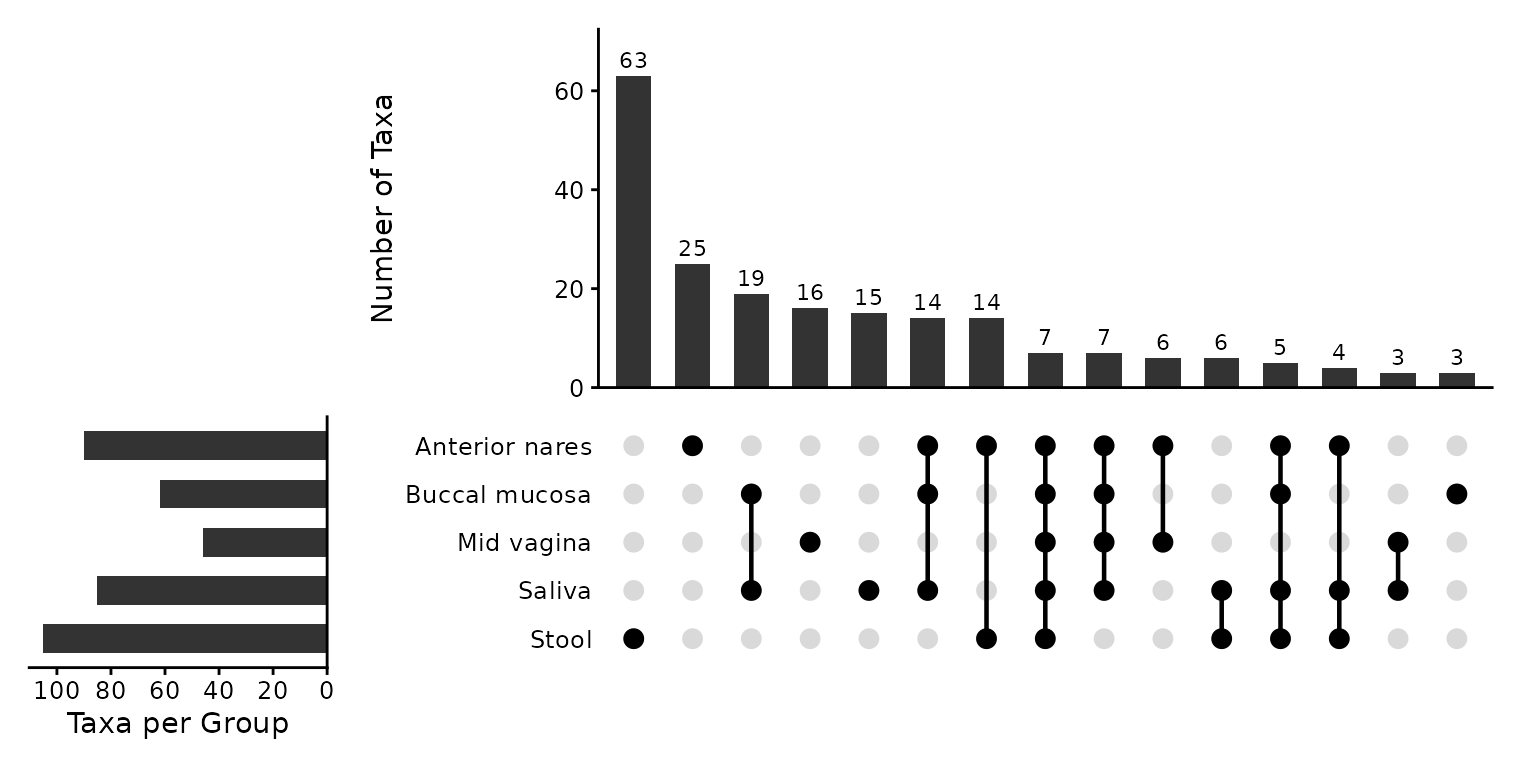
Draws the result of taxa_shared(): a bar for each combination of groups
showing how many taxa belong to exactly that combination, above a matrix
of dots that says which groups the combination is made of. Unlike a Venn
diagram, it stays readable with more than three groups.
Usage
taxa_upset(
  biom,
  stat.by,
  rank = -1,
  detect = 0,
  prev = 0,
  unc = "singly",
  lineage = FALSE,
  sets = 15,
  totals = TRUE,
  ...
)
Arguments
- biom
An rbiom object, or any value accepted by
as_rbiom().- stat.by
Dataset field with the groups to compare. Must be categorical, with at least two groups. Samples with
NAin this field are left out. Required.- rank
What rank(s) of taxa to display. E.g.
"Phylum","Genus",".otu", etc. An integer vector can also be given, where1is the highest rank,2is the second highest,-1is the lowest rank,-2is the second lowest, and0is the OTU "rank". Runbiom$ranksto see all options for a given rbiom object. Default:-1.- detect
Detection threshold. A taxon is present in a sample when its relative abundance there is greater than
detect, a fraction from 0 to 1 (0.001is 0.1%). The default counts any observation. Default:0- prev
Prevalence threshold. A taxon belongs to a group when it is present in at least this fraction of the group's samples, and in at least one of them. So
0needs a single sample,0.9needs 90% of the group's samples, and1needs all of them. Default:0- unc
How to handle unclassified, uncultured, and similarly ambiguous taxa names. Options are:
"singly"-Replaces them with the OTU name.
"grouped"-Replaces them with a higher rank's name.
"drop"-Excludes them from the result.
"asis"-To not check/modify any taxa names.
Abbreviations are allowed. Default:
"singly"- lineage
Include all ranks in the name of the taxa. For instance, setting to
TRUEwill produceBacteria; Actinobacteria; Coriobacteriia; Coriobacteriales. Otherwise the taxa name will simply beCoriobacteriales. You want to set this to TRUE whenunc = "asis"and you have taxa names (such as Incertae_Sedis) that map to multiple higher level ranks. Default:FALSE- sets
The maximum number of combinations (bars) to show. The largest are kept. Default:
15- totals
Show a bar for each group with the total number of taxa that belong to it. Default:
TRUE- ...
Parameters for the underlying ggplot2 functions, prefixed with the name of the part of the figure they apply to:
bar.(the bars for each combination;ggplot2::geom_col()),label.(the counts above them;ggplot2::geom_text()),dot.andempty.(the filled and unfilled dots;ggplot2::geom_point()),line.(the lines joining dots;ggplot2::geom_line()),total.(the bars for each group;ggplot2::geom_col()), andtheme_rbiom.(theme_rbiom(), for all panels). For example,bar.fill = "steelblue". An argument that no part accepts is an error.
Value
A ggplot2 plot (a patchwork of panels). The taxa_shared()
table is available as $data and $stats, and the code that
rebuilds the figure as $code.
Details
Whether a rare taxon is observed in a sample depends on how deeply the
sample was sequenced, so give this function rarefied counts (see
rarefy()).
See also
Other taxa_abundance:
sample_sums(),
taxa_boxplot(),
taxa_clusters(),
taxa_corrplot(),
taxa_da(),
taxa_forest(),
taxa_heatmap(),
taxa_shared(),
taxa_stacked(),
taxa_stats(),
taxa_sums(),
taxa_table(),
taxa_top()
Other visualization:
adiv_boxplot(),
adiv_corrplot(),
bdiv_boxplot(),
bdiv_corrplot(),
bdiv_heatmap(),
bdiv_ord_plot(),
plot_heatmap(),
rare_corrplot(),
rare_multiplot(),
rare_stacked(),
stats_boxplot(),
stats_corrplot(),
taxa_boxplot(),
taxa_corrplot(),
taxa_forest(),
taxa_heatmap(),
taxa_stacked(),
theme_rbiom()
Examples
library(rbiom)
biom <- rarefy(hmp50)
taxa_upset(biom, stat.by = "Body Site")
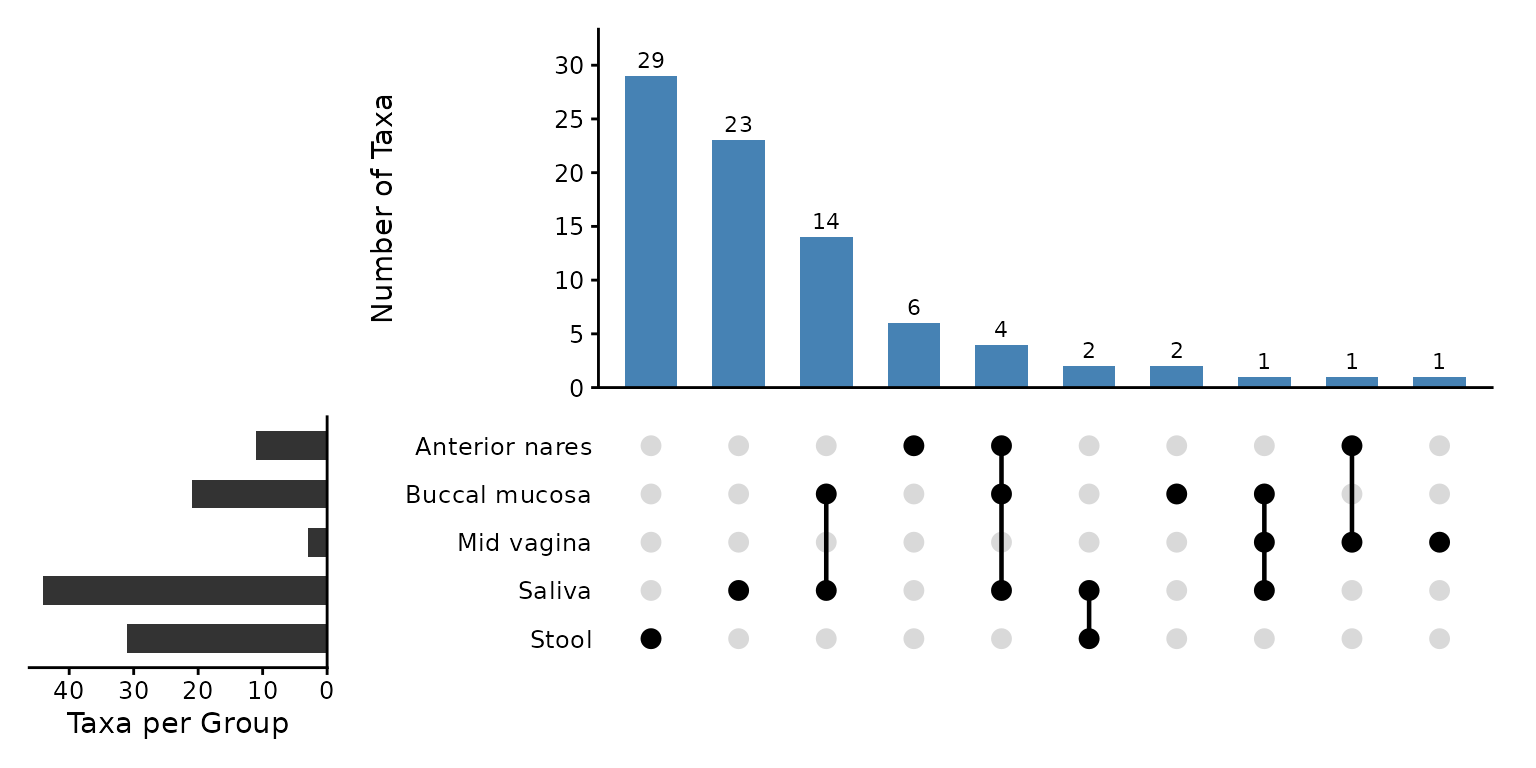
 # Core genera: present in at least half of a body site's samples.
p <- taxa_upset(biom, stat.by = "Body Site", prev = 0.5, bar.fill = "steelblue")
p
 # The taxa behind the bars.
p$stats
#> # A tibble: 83 × 13
#> .taxa `Anterior nares` `Buccal mucosa` `Mid vagina` Saliva Stool .n_groups
#> <fct> <lgl> <lgl> <lgl> <lgl> <lgl> <int>
#> 1 Alistip… FALSE FALSE FALSE FALSE TRUE 1
#> 2 Anaeros… FALSE FALSE FALSE FALSE TRUE 1
#> 3 Christe… FALSE FALSE FALSE FALSE TRUE 1
#> 4 Dorea FALSE FALSE FALSE FALSE TRUE 1
#> 5 Erysipe… FALSE FALSE FALSE FALSE TRUE 1
#> 6 Eubacte… FALSE FALSE FALSE FALSE TRUE 1
#> 7 Faecali… FALSE FALSE FALSE FALSE TRUE 1
#> 8 Fusicat… FALSE FALSE FALSE FALSE TRUE 1
#> 9 Lachnoc… FALSE FALSE FALSE FALSE TRUE 1
#> 10 Lachnos… FALSE FALSE FALSE FALSE TRUE 1
#> # ℹ 73 more rows
#> # ℹ 6 more variables: .set <fct>, `.prev.Anterior nares` <dbl>,
#> # `.prev.Buccal mucosa` <dbl>, `.prev.Mid vagina` <dbl>, .prev.Saliva <dbl>,
#> # .prev.Stool <dbl>